Improve how service teams perform with JSM reports
What gets measured gets managed. But too many IT teams aren't looking at reports. Let's dig in to why JSM reports matter.
Summary
- When IT teams don’t treat reporting as an essential part of their work, they can’t know how effective they are at solving their customers' problems.
- Jira Service Management (JSM) offers some excellent reporting options to help IT teams get the insights they need to continually improve.
- The three types of JSM reports are default reports (which can’t be edited), custom reports (which can be edited), and dashboards (for a high-level overview on multiple service projects).
- JSM’s customer satisfaction (CSAT) report is the most important report, although it is only the starting point for understanding your team’s performance.
- SLA reports, created vs resolved requests, request types, and requests deflected all help pinpoint the reasons for your CSAT ratings.
Why JSM reports matter
Implementing a help desk platform like Jira Service Management (JSM) is only the first step towards excellent service delivery. The next is making sure end users are getting the best service you can give them.
JSM excels at enabling service teams to respond quickly to requests, collaborate across different verticals, and streamline their processes. But service teams shouldn’t assume that they’re delivering excellent service just because the software is so much better than what they had before. They need to measure what they’re doing, how well they’re doing it, and look at the areas where they could do better. How? With JSM reports.
JSM reports help monitor team performance, workload trends, customer satisfaction, and more. In this article, we’ll look at how JSM reports are the difference between managing service and mastering it.
When IT teams don’t do reporting
One of the benefits of having an IT Service Management (ITSM) system like Jira Service Management is that you can track and measure what you’re doing. Without an ITSM system, trying to answer questions about workload and performance means digging through email chains and spreadsheets. The reality is that most service teams just don’t.
That said, although tools like JSM come with a range of reports, many teams don’t use them enough. Sometimes it’s because they’re so focused on keeping systems running and resolving incidents that they don’t ever prioritise tracking and measuring their output.
There’s also the fact that their workload is heavily interruption-driven, e.g. outages, urgent requests. Many support agents focus on firefighting rather than stepping back to analyse effectiveness.
But without ITSM reporting, recurring incidents, long resolution times, failed changes, and poor customer satisfaction can persist unnoticed. Teams don’t have the insights they need to improve, and this lack of data makes it hard for IT to demonstrate its value or to secure the resources it needs. Ultimately, IT gets viewed as a cost centre, not a strategic partner.
The best IT teams treat reporting as part of execution. So let’s look at how reporting is done in JSM, before digging in to some key ITSM metrics you should measure with JSM reports.
Reporting in Jira Service Management
Jira Service Management comes with three types of reports: default reports, custom reports, and dashboards.
Let’s look at these in turn.
Default JSM reports
The default reports in Jira Service Management are predefined and can’t be changed. These offer immediate visibility into your team’s workload and performance without having to build anything.
It’s worth mentioning here that two of the default reports help measure the value of your knowledge base. Knowledge bases are an important part of an ITSM team’s offering, because they enable customers to self-serve, i.e. answer their own questions. Knowledge bases reduce the number of routine support tickets and allow IT teams to focus on more important requests and projects. In a future article, we’ll talk more about the value of a knowledge base in your ITSM system.
The four default reports are:
- Workload: this shows the number of requests assigned to your agents in a simple list
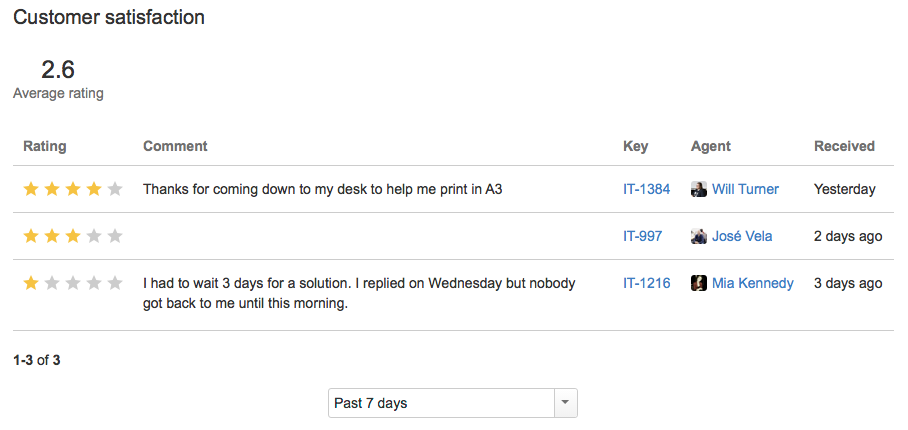
- Customer satisfaction (CSAT): this gives the average customer satisfaction rating for the team, then lists user reviews and ratings
- Requests deflected: this is a line chart showing how many times customers viewed knowledge base articles in your JSM portal, and how many support tickets were avoided as a result
- Requests resolved: a line chart showing the number of requests resolved with and without a knowledge base article.
Custom JSM reports
Jira Service Management also offers custom reports (all line charts). These are either predefined reports which can be edited, or reports you create yourself.
Here’s a list of the predefined ones that come with your service project:
- Created vs resolved: compares the number of requests created and resolved over a set period of time
- Time to resolution: compares the length of time taken to resolve requests of a specific type or priority
- SLA met vs breached: compares the number of requests that have met or breached a service-level agreement (SLA) goal
- Incidents/problems by priority: compares the priority of incidents your customers have reported, which helps teams to quickly identify the most critical issues (available for IT service projects only)
- SLA success rate: shows how the team is tracking towards their SLA goals
- Service requests: the types of service requests in your service project, so you can understand the most and least common types
- Change by type: a record of the standard, normal, and emergency changes made in your service environment.
- Time to approve normal change: shows the time for a change to go through, for example, an approval, so you can assess the efficiency of your change management procedures.
How to change the custom reports or create your own
You can edit the custom reports listed above by adding a series. A series is a metric or set of data points, e.g. the number of requests received on different days in the week. You can assign a colour and descriptive label to the series, and apply filters using standard fields, e.g. status, work item type, or Jira Query Language (JQL).
For example, the SLA met vs breached report has two series already set up. One is for all work items that met the SLA, the other is for all work items that breached it. You could another series to this chart showing work items at risk, i.e. close to breaching the SLA, to make the chart into a more proactive management tool rather than a post-mortem.
Instead of editing the existing custom reports, you can also start from scratch and define all the series yourself. You do this the same way as when adding series to existing templates: add a series, label it, select a colour and, if you wish, a filter. Then add more series to compare values. You can add up to 20 on the same chart.
For example, you could build a chart showing the average customer satisfaction rating for different work item types. Let’s say you have four work item types. You’d create four series and have a chart that looks like this:
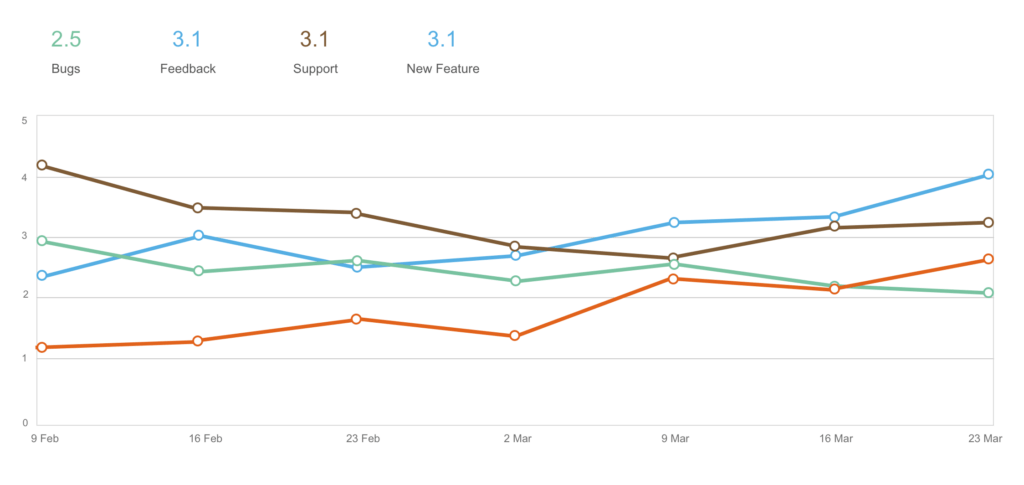
This chart helps support teams understand the areas where they’re pleasing customers versus areas where customers aren’t so happy.
JSM dashboards
The third reporting option available in Jira Service Management is dashboards. A dashboard is a single screen that displays multiple reports called gadgets.
One of the limitations of the default and custom JSM reports is that you can only report on one service project at a time. With dashboard gadgets, you can build reports that pull data from multiple projects and get a portfolio-level view of ITSM activities.
For example, you could track time to first response across multiple service projects and see if different support teams are responding to customers faster than others.
JSM dashboards are ideal for senior managers needing an overview of all the services being provided by the organisation. Remember, JSM is not just a tool for IT teams. It is actually more of an enterprise service management (ESM) platform in that you can have service projects for HR, legal, marketing, and finance as well. Dashboards can provide at-a-glance insights into all these departments' performance.
JSM dashboards are one of Jira Service Management’s most powerful features. The gadgets that come out of the box with JSM are much more insightful than those offered by many typical ITSM platforms. With JSM, you can have a detailed, highly visual dashboard that tracks your SLA performance, open requests, CSAT ratings, etc.
You can also enhance your dashboards with reporting apps from the Atlassian Marketplace, which let you visualise your data with different chart types, custom colours and labels, and advanced filters. Our Atlassian implementation services include the recommendation and integration of apps to extend your toolset and this includes extra reporting capabilities if your company needs them.
Now let’s look at some of the reports that you can make with JSM.
The best JSM reports for ITSM teams
Here are 5 Jira Service Management reports we think all support teams should be looking at.
1. SLA reports
This is actually multiple reports but we’re lumping them together because they all look at whether you’re achieving the goals you agreed with your customers. So, measuring common SLAs like time to first response, time waiting for support, and time to resolution are all important for knowing whether customers' expectations are being met.
In JSM, it’s really easy to configure SLAs. You can also set the conditions for starting and stopping the SLA timer, e.g. when you’re waiting for the customer. That way you can measure the true service level for your team.
2. Customer satisfaction (CSAT) report
It’s important to avoid the “watermelon effect”, i.e. where all your SLA metrics appear green, but under the surface, the true state of things is red. In other words, customers' problems are being solved on time, but they’re not happy with the solutions they’re getting. You can avoid the watermelon effect by tracking customer satisfaction alongside SLA attainment.
3. Created vs resolved requests
This is a great report for finding out if your support team is keeping up with demand or falling behind. It lets managers intervene early with extra staffing, prioritisation, or process changes before the backlog becomes unmanageable. You’re also able to see trends such as seasonal or recurring spikes in request volume so that you can plan and forecast better.
4. Service request types
A report that lists the types of service requests coming in allows you to see which categories generate the most tickets, e.g. password resets, VPN issues, software installations. You’re able to surface patterns that could indicate a need for automation, new knowledge base articles, or system upgrades.
5. Requests deflected
If you have a knowledge base connected to your JSM portal, this default JSM report offers an essential insight into its usefulness. If your knowledge base articles are successfully preventing the creation of tickets, then they’re doing their job. But if customers are still making requests after reading your articles, it means that they aren’t answering their questions and need improving.
JSM reports = knowledge
The most important metric for a support team is customer satisfaction. This is because the support team’s main role is to maintain and strengthen customer satisfaction, as well as to re-establish customer trust when something goes wrong. This is no doubt why the CSAT report is one of the default reports offered with Jira Service Management.
Of course, the CSAT report is only your starting point. JSM reports like time to resolution, requests deflected, and service request types can help understand the reasons behind your CSAT ratings. For example, if you’re getting lots of requests about VPN issues, this could be a reason why your CSAT ratings are lower; employees can’t access their company systems remotely, which is slowing their productivity.
Looking at CSAT in conjunction with these other metrics can also help you avoid the “watermelon effect”, where you’re hitting your SLA goals but your customers aren’t happy. For example, you could be resolving your customers' VPN issues by telling them to uninstall and reinstall the app. But if the problem reoccurs every time they try to connect, the solution isn’t working and IT should look at upgrading or changing the VPN software.
Basically, your organisation’s brand promise is riding on the support team’s shoulders. The best way to equip them for the task of maintaining that promise is to furnish them with knowledge. And the best way to furnish them with knowledge is with Jira Service Management reports.
If you want to deliver smarter service faster, Togetha can get you up and running with Jira Service Management in just two weeks.

